- SOLUTIONS
- SERVICES
Clients are kept up-to-date on the progress and outcomes of tasks or deliverables, but they are not directly involved in the work or decision-making process.
Consulting allows us to share our insights and suggestions to improve the quality or outcomes of the project or deliverable.
Projects can be business optimizations with tasks, timelines, milestones, and outcomes.
A Managed Service Provider (MSP) is a company that offers various IT services to help your business run smoothly and efficiently.
A Managed Security Service Provider (MSSP) offers comprehensive cybersecurity solutions to protect your business from online threats.
- TRAINING
Training Categories
- MARKETS
- ABOUT
- RESOURCES
Visualizing Data

Solutions For Data Visualization
- Microsoft Power BI
- Microsoft Power Platform
- Microsoft SharePoint Online
- Microsoft Dataverse
- Microsoft Dynamics 365
- Microsoft Teams
- Microsoft Visio Online
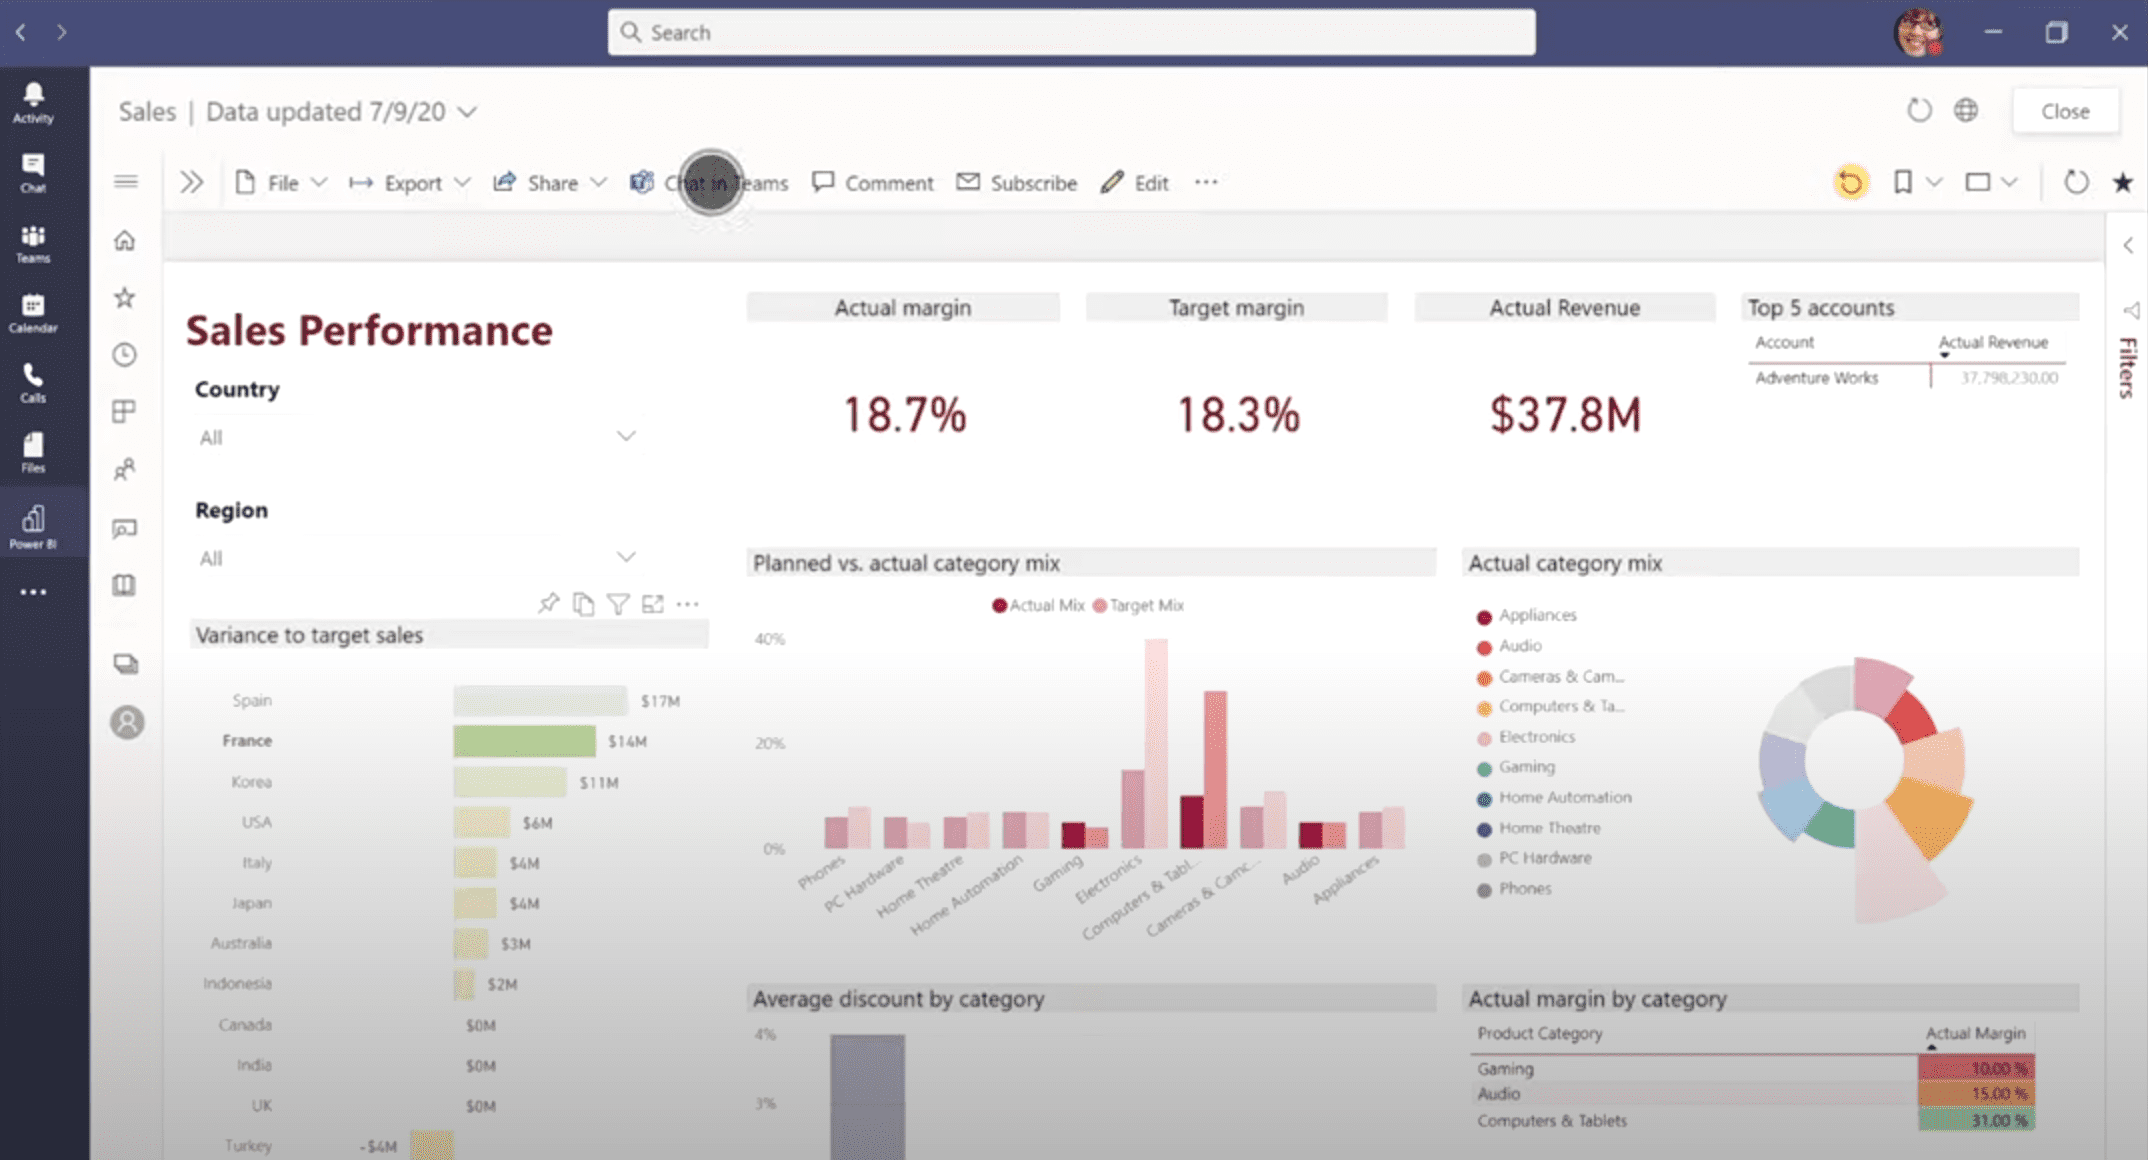
Does the idea of staring at another spreadsheet make you exhausted? With the use of Microsoft’s Power BI, Jadex can transform your spreadsheets and lists into beautiful data visualizations. These can be optimized to create robust dashboards, reports, and insights from your business intelligence. Combined, the Microsoft Power Platform and Microsoft Visio, can transform how you work.
Microsoft Resources
Playlist
3 Videos
How to Start Visualizing Your Data

Create a Data Fusion Team
Form a cross functional team whose purpose is to seek out & fuse data to create actionable insights through data visualizations.

Identify All Sources of Data
Identify & document all sources of data within your organization to included structured and unstructured data types.

Review Identified Data Sources
Meet with IT personnel & key stakeholders to review identified data sources for visualization opportunities utilizing Microsoft's Power Platform.

Perform Data Quality Control
Verify data being fed into your systems is properly standardized, and free of errors to ensure useful & impactful visualizations.

Connect & Create Visualizations
Transform complicated information into easy-to-share, interactive, and rich visuals that provide valuable real-time insights.

Integrate Visualizations
Microsoft 365 offers a myriad of applications & tools to enable robust visualization through dashboards & Power Platform integrations.
Frequently Asked Questions

What is Power Bi for?
It's a Microsoft Power Platform product that transforms your data into rich visuals and enables employees to make confident data-driven decisions.
Is Power Bi better than Excel?
In short, the application is just different than Excel and allows for varying functions. While Excel is primarily used for data entry and spreadsheets, Power Bi’s functionality transforms that data into easy-to-understand and actionable visuals.
Is Power Bi hard to learn?
It's an advanced application and requires considerable knowledge to utilize properly. However, learning how to leverage the application and implementing it into your everyday business tasks, will dramatically improve knowledge transfer and data analytics at all levels of your organization.
Is Power Bi better than Tableau?
Compared to Tableau, Microsoft's solution is easier to use, offers faster data processing, and costs less. It has an intuitive user interface and easily integrates with other Microsoft products.
How do you visualize data?
You simply take the data you wish to analyze and upload it into the application. From there, users can manipulate the data to produce stunning visualizations that can be shared, reviewed, and absorbed throughout the organization.
Company Details
- DUNS Number: 078570307
- CAGE Code: 6TX26
- NAICS Codes: 541690, 541990, 541611, 54618, 611420, 541370, 541519
Contact
- HQS - Spring Lake, MI
- Phone: 1 (833) 568-3925
- Email: info@jadexstrategic.com
Codes & Certs
- VOSB - self-certified
- SBA 8(a) - pending


